


 |
|

| NWS Jackson, Kentucky Click Here | Larger Radar Hover Over Radar |
| Countdown to Fall | ||
|
|
METRIC |
IMPERIAL
|
Updated: 24-07-2024 @ 3:45pm (0 sec ago) | |||||||||||||||||||||||||||||||||||||||||||||||||||||||||||||||||||||
| Temperature | Current Conditions | Forecast / Storm Prediction | ||||||||||||||||||||||||||||||||||||||||||||||||||||||||||||||||||||
|
|
|
||||||||||||||||||||||||||||||||||||||||||||||||||||||||||||||||||||
| Dew Point | Liquid Precipitation | Wind Speed | Sun/Moon | |||||||||||||||||||||||||||||||||||||||||||||||||||||||||||||||||||
|
|
|
|
|||||||||||||||||||||||||||||||||||||||||||||||||||||||||||||||||||
| Humidity | Barometer | |||||||||||||||||||||||||||||||||||||||||||||||||||||||||||||||||||||
|
|
|||||||||||||||||||||||||||||||||||||||||||||||||||||||||||||||||||||
| Cooling Degree Days | Ky Wx History | Heat Index | Air | |||||||||||||||||||||||||||||||||||||||||||||||||||||||||||||||||||
|
|
|
|
|||||||||||||||||||||||||||||||||||||||||||||||||||||||||||||||||||
| UV Summary/Forecast | Solar Summary | |||||||||||||||||||||||||||||||||||||||||||||||||||||||||||||||||||||
|
|
|||||||||||||||||||||||||||||||||||||||||||||||||||||||||||||||||||||
| Almanac | Irrigation Index5 | Station All Time Records | Cloud Level | |||||||||||||||||||||||||||||||||||||||||||||||||||||||||||||||||||
|
|
|
|
|||||||||||||||||||||||||||||||||||||||||||||||||||||||||||||||||||


| 1 Rain season: Jan 1st to Dec 31st. 6 Air Quality Index is provided by Minnesota Polution Control Agency and is updated hourly between the hours of 6AM and Midnight. 10 Historical average only to day 10 of just the month of August for this station since 2012. 11 Historical average rain this season to day 10 of August for this station since 2012. |
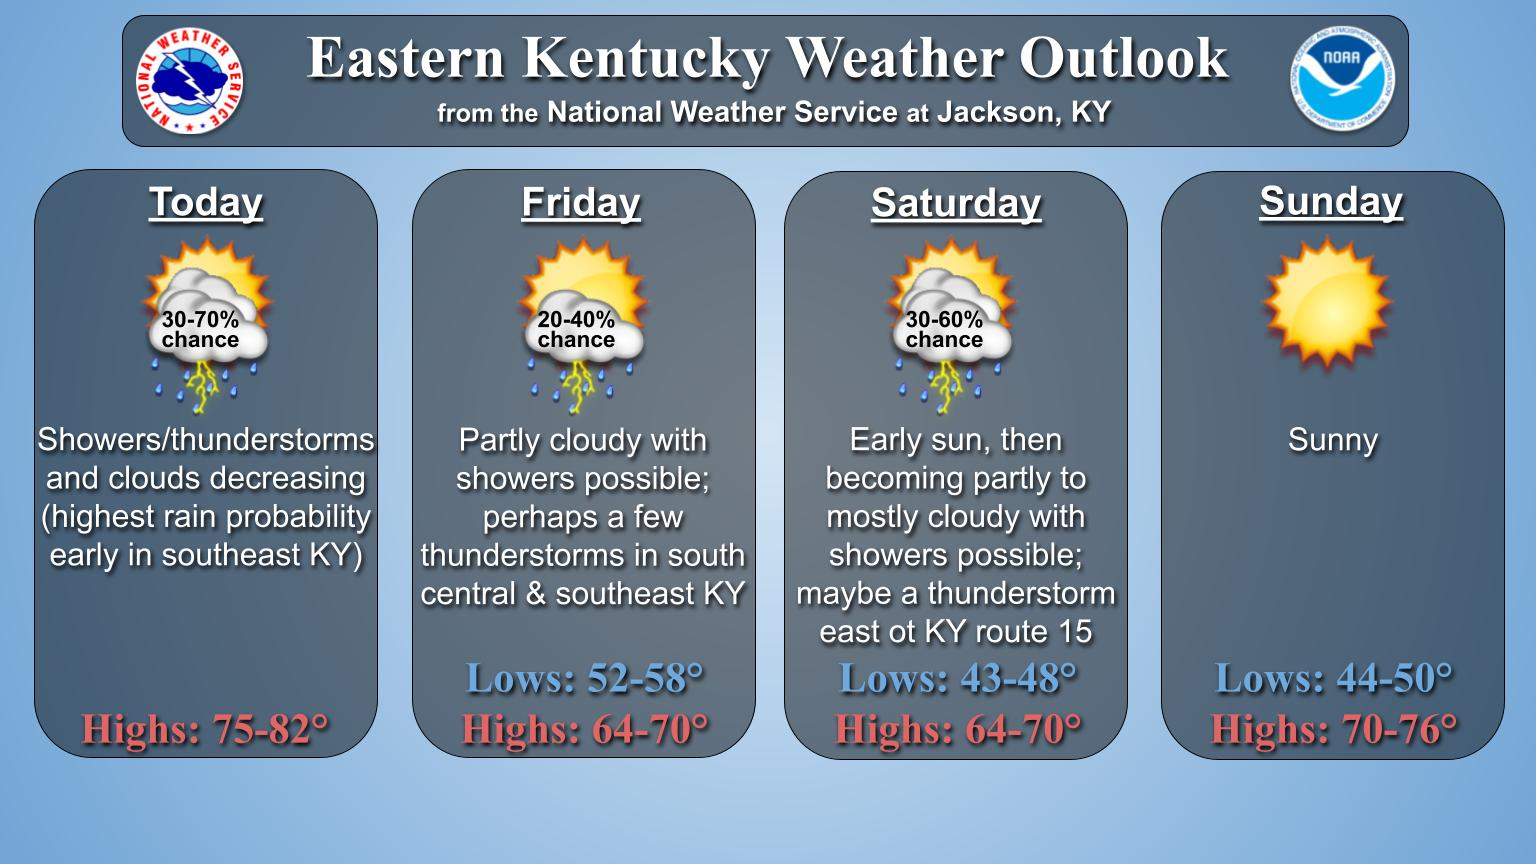
| NWS Weather Forecast - Outlook Today & Tonight | ||||||||||||||
|
||||||||||||||
|
||||||||||||||
|
||||||||||||||
|
ajax-dashboard6.php - Version 6.95h - 20-Feb-2023 - Script by: Scott of BurnsvilleWeatherLIVE.com Now supported by Saratoga-weather.org Download |
||||||||||||||

Enhanced Fujita Scale or EF-Scale - A scale of wind damage intensity in which wind speeds are inferred from analysis of wind damage. All tornadoes and most other windstorms are assigned a numerical rating from this scale according to the most intense damage caused by the storm. EF0 (weak) 6585 mph, light damage EF1 (weak) 86110 mph, moderate damage EF2 (strong) 111135 mph, considerable damage EF3 (strong) 136165 mph, severe damage EF4 (violent) 166200 mph, devastating damage EF5 (violent) >200 mph, incredible damage