


 |
|

| NWS Jackson, Kentucky Click Here | Larger Radar Hover Over Radar |
| Countdown to Fall | ||
|
|
METRIC |
IMPERIAL
|
Updated: 06-07-2024 @ 8:40pm (0 sec ago) | |||||||||||||||||||||||||||||||||||||||||||||||||||||||||||||||||||||
| Temperature | Current Conditions | Forecast / Storm Prediction | ||||||||||||||||||||||||||||||||||||||||||||||||||||||||||||||||||||
|
|
|
||||||||||||||||||||||||||||||||||||||||||||||||||||||||||||||||||||
| Dew Point | Liquid Precipitation | Wind Speed | Sun/Moon | |||||||||||||||||||||||||||||||||||||||||||||||||||||||||||||||||||
|
|
|
|
|||||||||||||||||||||||||||||||||||||||||||||||||||||||||||||||||||
| Humidity | Barometer | |||||||||||||||||||||||||||||||||||||||||||||||||||||||||||||||||||||
|
|
|||||||||||||||||||||||||||||||||||||||||||||||||||||||||||||||||||||
| Cooling Degree Days | Ky Wx History | Heat Index | Air | |||||||||||||||||||||||||||||||||||||||||||||||||||||||||||||||||||
|
|
|
|
|||||||||||||||||||||||||||||||||||||||||||||||||||||||||||||||||||
| UV Summary/Forecast | Solar Summary | |||||||||||||||||||||||||||||||||||||||||||||||||||||||||||||||||||||
|
|
|||||||||||||||||||||||||||||||||||||||||||||||||||||||||||||||||||||
| Almanac | Irrigation Index5 | Station All Time Records | Cloud Level | |||||||||||||||||||||||||||||||||||||||||||||||||||||||||||||||||||
|
|
|
|
|||||||||||||||||||||||||||||||||||||||||||||||||||||||||||||||||||


| 1 Rain season: Jan 1st to Dec 31st. 6 Air Quality Index is provided by Minnesota Polution Control Agency and is updated hourly between the hours of 6AM and Midnight. 10 Historical average only to day 6 of just the month of July for this station since 2012. 11 Historical average rain this season to day 6 of July for this station since 2012. |
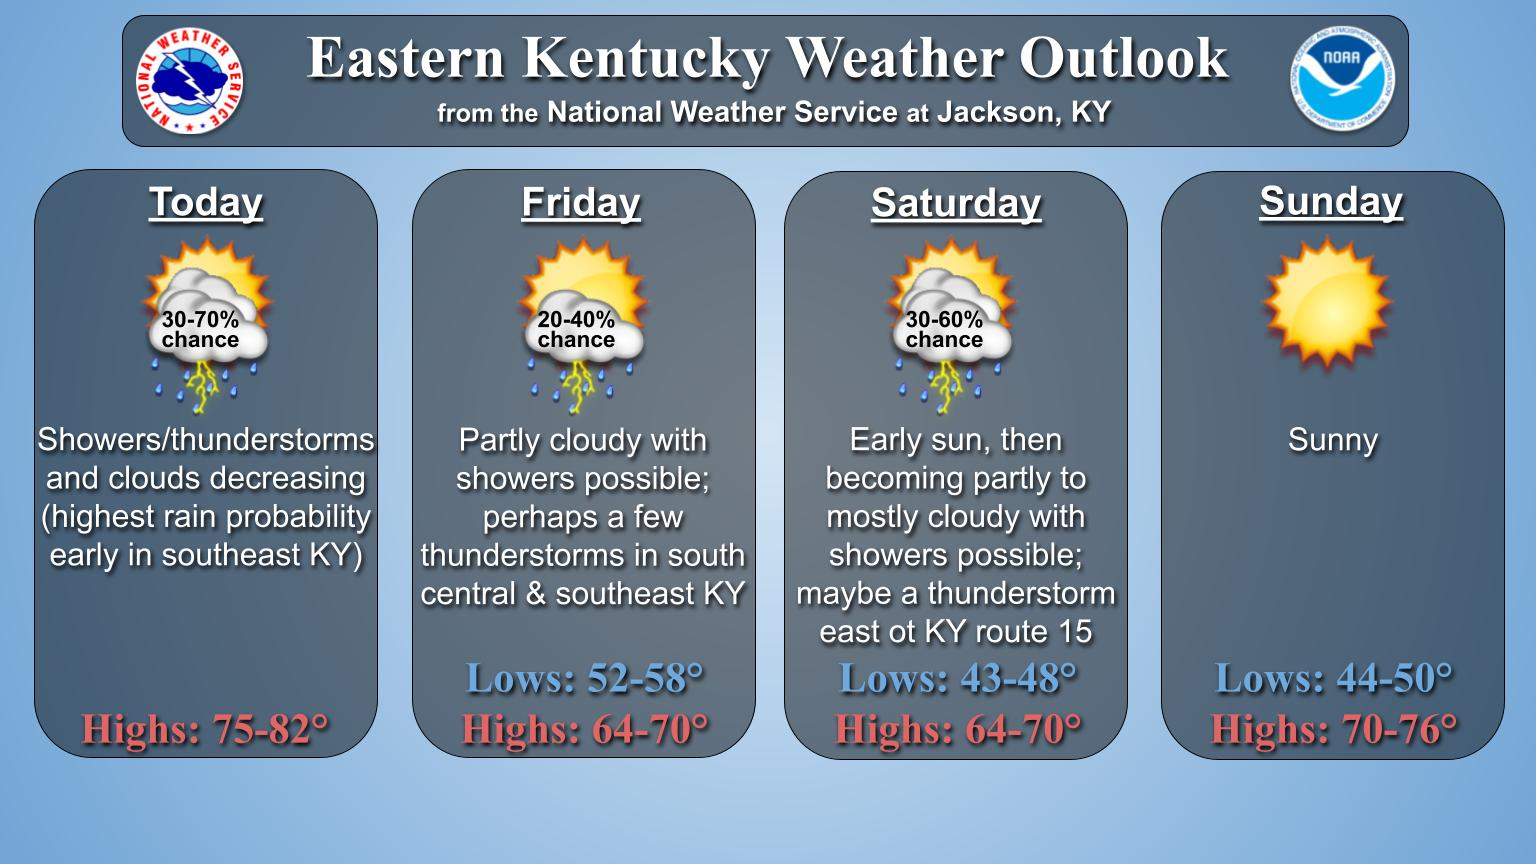
| NWS Weather Forecast - Outlook Tonight & Sunday | ||||||||||||||
|
||||||||||||||
|
||||||||||||||
|
||||||||||||||
|
ajax-dashboard6.php - Version 6.95h - 20-Feb-2023 - Script by: Scott of BurnsvilleWeatherLIVE.com Now supported by Saratoga-weather.org Download |
||||||||||||||
Degree Day - Gauges the amount of heating or cooling needed for a building using 65 degrees as a baseline. To compute degree days, the average temperature for a day is taken and referenced to 65. An average temperature of 50 yields 15 heating degree days, while an average temperature of 75 would yield 10 cooling degree days.